Health Check notification with severity level: WARNING - CPUC:Health Check Result:[[status=WARNING, message='CPU%: 76.8, Time CPU used: 171 milliseconds'']']HealthCheck Service Configuration
As with any other services available in Payara Server, the HealthCheck service can be configured by using the web console, administration commands or editing the domain.xml configuration file directly.
Using the Web Administration Console
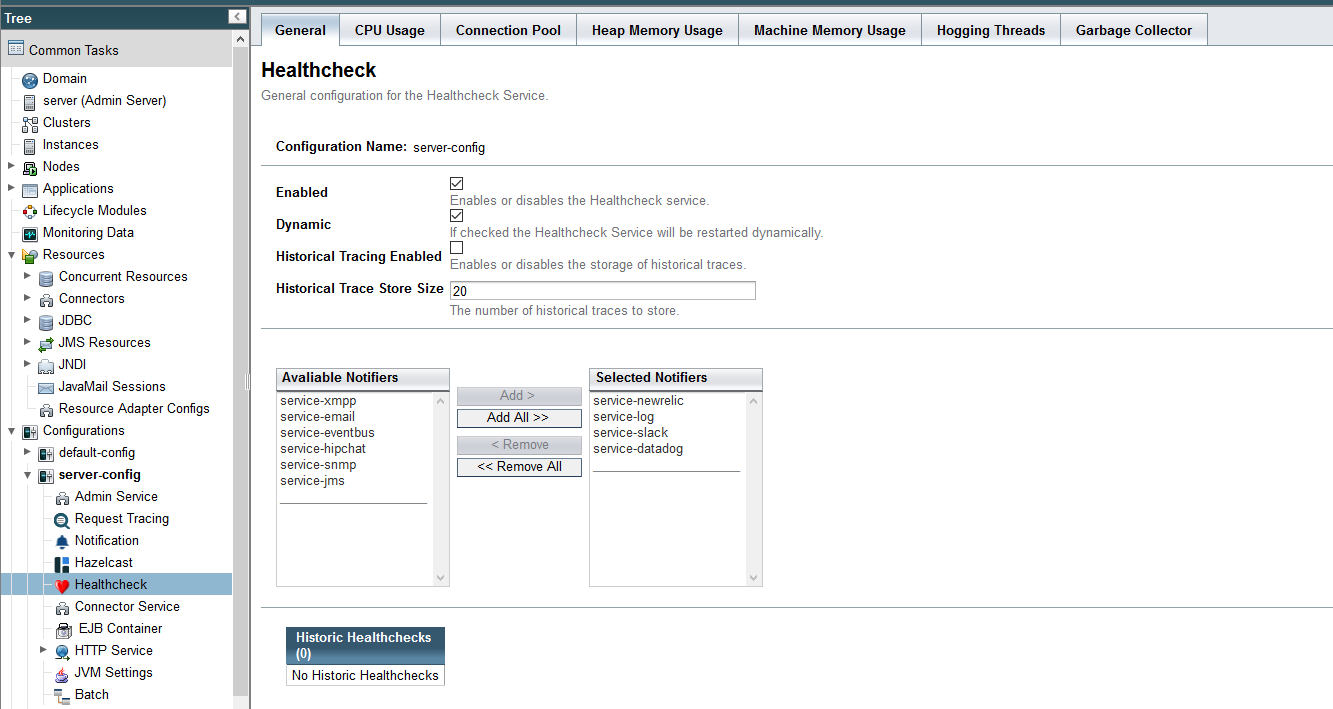
To configure the Request Tracing Service in the Administration Console, go to Configuration → [instance-configuration (like server-config)] → Healthcheck:
The HealthCheck service configuration is stored in the domain.xml. An
example can be seen below:
Check the Enabled box (and the Dynamic box too if you don’t want to restart the domain) to switch the HealthCheck service on.
The general settings of the service are:
- Threshold Unit
-
This defines the time duration per unit. The accepted options are any valid java.util.concurrent.TimeUnit values. The default value is SECONDS.
- Threshold Value
-
This defines the number of units beyond which a request will be traced.
- Store Historic Traces
-
When present, enables the storage of the slowest historical request trace events.
- Historic Trace Store Size
-
Determines the number of historical trace events that can be stored in memory when historical storing is enabled. The default value is 20 records
Aside from this configuration settings, you can also define which notifiers will be used to relay the HealthCheck events by moving them to the Active Notifiers box.
|
Important
|
Keep in mind that for HealthCheck events to be relayed to the active notifiers, both the Notification Service and each respective notifier must be enabled first. |
|
Tip
|
You don’t need to manually add each notifier on this screen. When enabling a notifier on its configuration screen, the server will automatically add it to the list of active notifiers for the HealthCheck service. This same result occurs when enabling the notifier using the appropriate asadmin command. |
|
Note
|
Configuring active notifiers for the HealthCheck service is a feature available from Payara Server 4.1.2.172 onwards. |
Configuring the Available Checkers
Each of the available checkers that are used to determine the server’s health can also be configured separately from each other on the admin console. The list of the available checkers is as follows:
- CPU Usage
-
Calculates the CPU usage and prints out the percentage along with the usage time.
- Connection Pool
-
Calculates the ratio of free/used connections available for all JDBC connections pool an prints the percentage of used connections for each active pool.
- Heap Memory Usage
-
Calculates the heap memory usage and prints out the percentage along with initial and committed heap sizes.
- Machine Memory Usage
-
Calculates the machine memory usage and prints out the percentage along with the total and used physical memory size.
- Hogging Threads
-
Identifies the threads that are hogging the CPU.
- Garbage Collector
-
Calculates and prints out how many times GC is executed with its elapsed time.
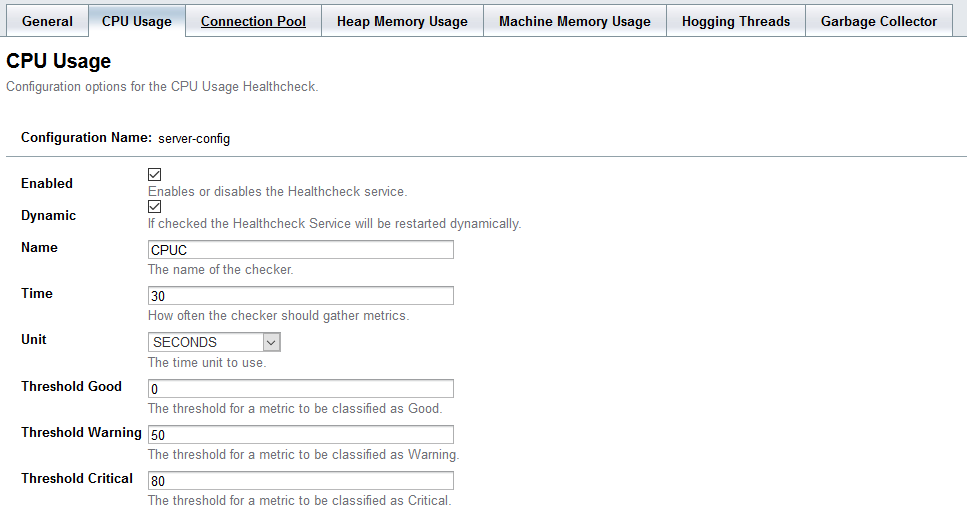
You can configure the settings for each checker on the respective tab in the web console. Here’s a sample image with the current configuration for the CPU Usage checker:
Common Checker Configuration
The following are the configurable attributes available to ALL the checkers:
- Enabled
-
Determines whether or not the checker is enabled.
- Dynamic
-
Determine whether the changes done to the checker’s configuration are applied immediately or after the server/instance’s restart.
- Name
-
The name or label that the checker will use to identify itself on the notification events. The default names for all checkers are the following:
Checker Default name CPU Usage
CPUCConnection Pool
CONPHeap Memory Usage
HEAPMachine Memory Usage
MEMMHogging Threads
HOGTGarbage Collector
GBGC - Time
-
The time interval value (as an
Integer) specified in given unit to execute the checker for the metric. The default value is 5. - Unit
-
This defines the time duration per unit. The accepted options are any valid java.util.concurrent.TimeUnit values. The default value is MINUTES.
Threshold Range Configuration
The following attributes are available to the CPU Usage, Connection Pool, Heap Memory Usage and Machine Memory Usage checkers:
- Threshold Good
-
The upper numeric boundary (valid
Integer) of the metric used by the checker for the notification event to be classified as GOOD. It has 0 as default value. - Threshold Warning
-
The upper numeric boundary (valid
Integer) of the metric used by the checker for the notification event to be classified as WARNING. It has 50 as default value. - Threshold Critical
-
The upper numeric boundary (valid
Integer) of the metric used by the checker for the notification event to be classified as CRITICAL. It has 80 as default value.
|
Note
|
The threshold values range (GOOD - WARNING - CRITICAL) are used to correctly warn users of the health of an specific metric depending on their value when they are measured based on the checking frequency. For example, if the CPU Usage checker is configured with the default threshold values, and at measuring time, the CPU is performing at 76,8%. Then this notification event would be generated: |
Special Checkers Configuration
The Hogging Threads and the Garbage Collector checkers are special on their configuration. They do not have a threshold range configuration, instead opting for different attributes.
Here’s a configuration sample of the Hogging Threads checker:

The following are the attributes used to configure this checker:
- Threshold Percentage
-
Defines the minimum percentage needed to decide if the thread is hogged CPU-wise. The percentage is calculated with the ratio of elapsed CPU time to checker execution interval. Its default value is 95.
- Retry Count
-
Represents the count value that should be reached by the hogged thread in order for the service to send notifications. Its default value is 3
And here’s a configuration sample for the Garbage Collector checker:
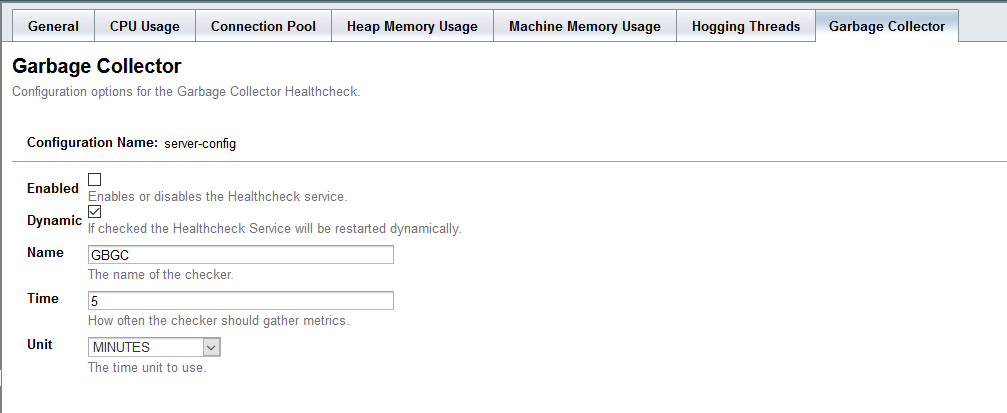
As you can see in the image, this checker doesn’t have any special configuration attributes.
Editing the domain.xml configuration file
To configure the HealthCheck Service in the domain.xml configuration file,
locate the health-check-service-configuration element in the tree and modify
the attributes described in the previous section:
<health-check-service-configuration enabled="true">
      <cpu-usage-checker unit="SECONDS" time="30" enabled="true">
          <property name="threshold-critical" value="80"></property>
          <property name="threshold-warning" value="50"></property>
          <property name="threshold-good" value="0"></property>
      </cpu-usage-checker>
      <heap-memory-usage-checker time="1" enabled="true">
          <property name="threshold-critical" value="80"></property>
          <property name="threshold-warning" value="50"></property>
          <property name="threshold-good" value="0"></property>
      </heap-memory-usage-checker>
      <hogging-threads-checker threshold-percentage="85" retry-count="5" enabled="false">
      </hogging-threads-checker>
      <log-notifier enabled="true"></log-notifier>
      <datadog-notifier enabled="true"></datadog-notifier>
      <xmpp-notifier></xmpp-notifier>
      <email-notifier></email-notifier>
      <slack-notifier enabled="true"></slack-notifier>
      <eventbus-notifier></eventbus-notifier>
      <hipchat-notifier></hipchat-notifier>
      <new-relic-notifier enabled="true"></new-relic-notifier>
      <snmp-notifier></snmp-notifier>
      <jms-notifier></jms-notifier>
</health-check-service-configuration>
The element contains the information for both the configuration on each checker and
the notifiers as well. Each checker configuration sub-tag contains the attributes
for its settings as well (enabled, time, unit and so forth). However, the
settings for the threshold-ranges need to be
configured using <property> sub-tags.
To activate a notifier for the service, simply change the enabled attribute of the
notifier sub-tag (e.g. for the Hipchat Notifier, use the hipchat-notifier sub-tag
and so forth).
|
Note
|
If a checker or notifier sub-tag element are not present in the configuration, then that checker or notifier will be treated as inactive when the server starts. |
|
Warning
|
Modifying the domain.xml configuration is not a supported configuration method, so be careful when considering this option. |
From the Command Line
You can configure the Request Tracing Service by using the administrations commands documented on the corresponding section
The main configuration tag is the <health-check-service-configuration>
which can be found directly under the parent config tag,
<config name="server-config"> for example. It has only one attribute
named enabled, which can be set to either true or false to turn
the entire Healthcheck service on or off.